Client Portal FAQ
Written By El
Last updated 5 days ago
General
Q: What is the new Client Portal?
A: Your Analytics will now be available on Prodify, a new platform designed to give you:
Streamlined Access to Your Data: The same trusted analytics, now delivered in a cleaner, more intuitive environment — including a redesigned Overview, Product Intelligence, and Firm Intelligence experience.
Future-Ready Tools: This is the first step toward a more unified experience, with billing, content management, and other enhancements on the way.
A Unified Experience: Your new portal is just the start—over time, all your CADdetails tools will come together in one seamless experience on the Prodify platform.
Q: What is Prodify?
A: Prodify is a Digital Asset Management (DAM) + Product Information Management (PIM) platform designed to help building product manufacturers streamline content management, improve distribution, and deliver accurate product data to architects, designers, and specifiers.
Q: Is CADdetails rebranding under Prodify?
A: No, CADdetails remains its own channel brand, powered by Prodify for relevant BPM channels like the client portal analytics.
Q: How is it different from CADdetails?
A: CADdetails is a distribution & visibility platform (channel for reaching the AEC community). Prodify is a content management & publishing platform (organizing and managing product data, assets, and specifications).
Q: Is there an additional cost for this upgrade?
A: No. The new Client Portal is included in your CADdetails subscription at no extra charge.
Q: Can I export data from my Analytics dashboard?
A: Yes. Use the Export Summary button at the top of the Overview tab to export images of the Overview, Product Intelligence, and Firm Intelligence tabs, plus Excel files of your Performance Over Time trend and Top Performing Content table, reflecting any filters you've applied.
Q: Where can I see which professional roles are engaging with my content?
A: The Audience Profession Split graph — available on both the Overview tab (your company's data) and the Product Intelligence tab (platform-wide) — shows which roles, such as architects and technical developers, are engaging with your products most, helping your team prioritize outreach.
Account & Login
Q: How do I access the new Client Portal?
A: You’ll receive an email with instructions to set up your Prodify account and password so you can log in to the new portal.
Q: What if I have trouble logging in and need assistance?
A: If your login doesn't work, start the "Forgot Password" process to retrieve your access information. If you still experience issues, you can also contact analytics@caddetails.com.
Access & Permissions
Q: Will my team’s existing user roles and permissions carry over?
A: Users with access to CADdetails Analytics will be granted Admin access in Prodify. Admins can then assign Editor and Viewer access to other team members once logged in.
Q: What are the user roles in Prodify?
A: Admins
Manage company settings and user accounts.
Edit permissions for all content and folders.
Access billing and subscription information.
Set default views (table, gallery, form).
Create share groups.
Best for manager-level users.
Editors
Edit and organize content into folders.
Add favorites.
Share assets and folders externally.
Create share groups.
Best for marketing team members.
Viewers
View and download content.
Add favorites.
Share assets and folders.
Best for sales representatives and SDRs.
CADdetails Analytics and Google Analytics
Q: How do your Analytics compare to Google Analytics?
A: Our analytics are designed specifically for product marketing performance on CADdetails and Design Hub, whereas Google Analytics (GA4) is a general, directional web analytics tool.
Because CADdetails is a third-party platform, clients cannot implement GA4 tracking on our site. While GA4 can be enabled on your own Design Hub, it will only capture part of the user journey. Our reporting fills that gap by providing a complete, end-to-end view of how users discover, engage with, and act on your products within our ecosystem.
Key advantages of our analytics:
More accurate data collection: We combine both client-side and server-side tracking, ensuring higher data reliability and reducing gaps caused by browser restrictions or ad blockers.
Advanced bot mitigation & data clean-up: Unlike GA4, which is largely directional and can include noise, we actively filter bots and invalid traffic to deliver clean, decision-ready data.
Intent-based insights (CADdetails): We go beyond pageviews and sessions to identify user intent signals (e.g., product interactions, downloads, spec engagement), helping you understand why users engage—not just that they did.
Firm-level intelligence (CADdetails): Our reporting includes a firm-level leaderboard enriched with firmographic data, allowing you to see which companies are engaging with your content—making it directly actionable for sales and marketing teams.
Full journey visibility (Design Hub): We connect user activity across touchpoints to provide a holistic view of the buyer journey, which GA4 cannot do in this context.
Q: Why not just rely on GA4?
A: GA4 is a powerful but directional analytics tool, it focuses on trends and aggregated behavior rather than verified, identity-enriched insights. It also depends heavily on client-side tracking, which can result in data loss due to privacy controls, ad blockers, and cookie restrictions (drops anywhere from 5%-25% of activity).
In contrast, our analytics are purpose-built to deliver accurate, enriched, and actionable insights tailored to your product performance within the CADdetails ecosystem.
Q: How does hosting content on CADdetails impact our own website's SEO and search rankings?
Hosting content on CADdetails is designed to work with your SEO, not against it — and in most cases, it actively benefits it. Here's why:
We attract a different audience than Google
CADdetails serves a high-intent, niche audience — architects, designers, and specifiers searching for technical files and product information. This is largely a different audience than your typical Google traffic, meaning the visits we drive to you are additive rather than competitive.
We rank for different search terms
CADdetails tends to appear in searches for technical, file-based queries — think "fireplace CAD drawings" or "curtain wall detail." Your own website ranks for your brand and product terms. Because we're targeting different search intents, there is very little overlap in the queries we compete for.
Your content outranks ours on specific searches
Granular content like project case studies sits deep within CADdetails' URL structure, which means it carries relatively low SEO weight on our end. For that same content on your own site, your authority is significantly stronger. In practice, if someone searches for a specific project or product of yours, your site will appear well ahead of ours.
CADdetails is a high-authority referring domain
Following Google's 2026 updates placing greater emphasis on backlinks, being listed on CADdetails is a direct SEO asset. CADdetails currently sits at an average domain ranking of 7.8, meaning we consistently appear in the first seven to eight search results in the AEC space. Every listing on CADdetails generates a backlink to your website from that high-authority domain — and the stronger the referring domain, the better the impact on your rankings.
There is no SERP conflict for direct searches
CADdetails will never compete with your website for a direct, brand-specific search. Your origin domain will always take precedence for searches tied directly to your brand or specific content.
The bottom line: CADdetails functions as a high-authority referral source within the AEC space, driving qualified traffic to your site while simultaneously contributing backlink value to your overall SEO profile. Rather than diluting your search presence, hosting content on CADdetails strengthens it.
Data & History
Q: What is new in the redesigned Analytics Dashboard?
A: Your CADdetails Analytics dashboard has been redesigned around three tabs: Overview (your at-a-glance performance summary), Product Intelligence (platform-wide benchmarking for your product categories), and Firm Intelligence (your design firm leaderboard with deeper user-level detail). See the CADdetails Analytics User Guide for a full walkthrough.
Q: What is the goal of the CADdetails Analytics?
A: Our modern data ecosystem allows us to stay current with changing industry standard KPIs, evolve with the data space, and present/maintain intuitive interactive dashboards. The updated tracking methodology allows us to identify and present the most relevant and actionable information to clients. With the new search, filter, and company profile functionalities on CADdetails.com, the user behaviours possible on our site(s) have changed and we always aim to present the most accurate representation of that behaviour while still supporting and integrating historical engagement into client facing analytics.
Q: Why is the data different for the CADdetails Analytics 1.0 vs CADdetails Analytics 2.0?
A: Our team is constantly working on improving our site and products, you may have noticed the significant design/functionality changes to our website over time. With the continuous improvement of our platform, we need to maintain consistent and accurate performance reporting so that insights are reliable and reflect the engagement on CADdetails.com. Changes to our site impact user behavior and our analytics correctly capture all of that activity, some of which would be miscategorized or dropped entirely if updates to the data models were not made to match the new experience. These are the key reasons why we continue to update the analytics offering in step with significant site changes.
Historical data is maintained and integrated into your analytics reports so there is no interruption to your ability to interpret the engagement on CADdetails.com and Design Hub. However, the changes do impact user behaviour and therefore can be directly observed in your KPIs, please take note of when significant changes occur so you understand sudden changes in event
Q: How do the KPIs in the CADdetails Analytics 2.0 compare to the KPIs in the existing CADdetails Analytics 1.0 program?
A: On September 9, 2026 we launched new search and company profiles on CADdetails.com. Specifically, regarding the KPIs, this summarizes how they are defined in CADdetails Analytics and how they have changed as a result of these website upgrades:
Impressions: The number of times your content was displayed in search/filter results, landing pages and company profiles. The impressions metric provides more insight into your overall exposure on CADdetails, accurately measuring how many times your content was displayed to users. Key changes to this metric:
In effort to drive users to the most relevant content and alignment with the modern search best practices, we have changed how content is displayed on CADdetails.com. Specifically, instead of Products (formerly called "Listings") showing in search/filter results we are now presenting content at the Product Family (formerly "Products") level. This means that all Products are nested under their associated Product Family card in search and filter results. This keeps all relevant content together rather than having it split across multiple cards which made it difficult for users to identify all the product variants that are relevant. As a result, the overall number of cards displayed is reduced which directly impacts the impressions metric.
Google has updated their analytics policy to only count impressions on the first page of results to better represent the actual number of times results are seen by users after performing a search. CADdetails is also adopting this as best practice for impressions reporting. This means that only the results on the page that is being viewed will be counted towards the impressions KPI. So, rather than counting if a Product Family shows up in a search/filter on any page, it is counting if the Product Family showed up in the results on the page being viewed, not on the 100th page of results where it likely wasn't seen by users (unless the user actually navigate to the 100th page of results).
For searches and filters which result in more than 1 page of results, this first page will only return the first 50-60 product family cards.
The impact of this change will vary between clients based on their Product to Product Family relationships and volume of content relevant to the search/filter performed by the user. Overall, we expect an average of 30% decrease in the number of impressions. However, the goal is to drive conversion events such as Clicks and Downloads by presenting only the most relevant content to users in this new format. Therefore, while impressions will likely decrease, it's important to evaluate that metric along side conversion metrics for a complete picture of performance on CADdetails.com
Impressions data to September 9, 2026 is still fully integrated into the dashboards but changes to the volume of impressions will likely be observed following this date based on the aforementioned structural changes to CADdetails.com.
Clicks: The number of times users clicked on your content. There is no expected change to this metric although our intention with the new user experience is to drive more direct click engagement for users with high intent in your product categories.
Downloads: The number of times users downloaded your company content on CADdetails. As above with Clicks, there is no expected change to this metric although our intention with the new user experience is to drive more direct download engagement for users with high intent in your product categories.
Unique Users: The total number of unique users, including both registered users and anonymous visitors, who either performed a search, in which your results were displayed, a click on your content, or a download of your content. We expect that a potential side effect of showing the most relevant results may reduce this exposure metric in a similar fashion to impressions. However, the users being exposed to your content should have higher intent and therefore convert more on your content.
Active Firms: Total unique Design Firms engaging with your content and/or exposed to your content through search or filter actions for selected dates. This KPI was not available before, now it appears on the Overview and Product Intelligence tabs to provide visibility into the number of active firms based on registered users engaging with relevant content. We have backfilled historical data for this KPI and we expect it to mirror the fluctuations that other exposure metrics (Impressions and Unique Users) are subject to.
Q: What are the changes to caddetails.com and how do they impact the analytics?
Q: Why did my Product Categories (Firm Intelligence/Leaderboard) change?
A: As we updated our taxonomy we are transitioning from the legacy product categorization which is based on Omniclasses and MasterFormats to our proprietary product taxonomy defined by AEC search which includes Product Categories > Product Types > Specific Product Types you will see different options in the Product Categories column on the "Full Leaderboard" and the associated filter. Over the next 12 week period ending on December 2, 2026, you will see these values stabilize to more concise and meaningful values that will help you better understand what users are looking for when browsing your products and related products on caddetails.com.
Q: Why did the groupings on the Asset Type Distribution (Overview/Performance) change?
A: We simplified the Asset Type Distribution chart to make it easier to read and act on at a glance.
Previously, the chart broke out every possible download combination separately — CAD/BIM packages, BIM/3D packages, and so on — which created a long, cluttered list that was difficult to interpret. In Analytics 2.0, downloads are now grouped into six clean categories:
CAD — downloads containing only CAD files
BIM — downloads containing only BIM files
3D — downloads containing only 3D files
SPEC — downloads containing only specification files
Product Info — downloads containing only product media (brochures, project images, education materials, etc.)
Packages — any download containing a mix of the above asset types (e.g., a CAD + BIM download, or a BIM + 3D download)
You will notice a small reduction in granularity for mixed-asset downloads, as those are now consolidated under "Packages" rather than broken out by combination. This was an intentional trade-off to make the chart cleaner and more actionable for the majority of use cases.
Looking ahead, we are working toward an asset-level breakdown that will show you exactly how many individual files of each type were downloaded - not just the download event grouping. This will give you a much more precise picture of what your audience is accessing, with no ambiguity. We'll share more on that when it's available.
Q: What is the Product Intelligence tab?
A: Product Intelligence is a new tab that shows platform-wide engagement data for your relevant product categories — not just your own company's data — so you can benchmark your performance against the platform average and spot demand trends across product types.
Q: What is the Firm Intelligence tab, and how is it different from the Design Firm Leaderboard?
A: Firm Intelligence is the new name for the Design Firm Leaderboard. It still ranks the design firms most engaged with your content, and now also includes a persistent user-preview panel, an interactive regional map, and a "View Full Leaderboard" modal with sortable, exportable data covering all top 250 firms.
Q: What is the difference between Product Types (Product Intelligence) and Product Categories (Firm Intelligence)?
A: Product Types are the distinct groups of products that your product catalog is directly tied to according to the Product Taxonomy that drives our filters on CADdetails.com and groups products together across the competitive group. Product Categories represent the areas of interest for relevant users on your Leaderboard - these values will reflect the taxonomy that your products belong to and those which are closely related to give you insight into what users were most interested in during the last 12 weeks with no blind spots.
Q: Why is the leaderboard limited to only 250 design firms? Could we potentially miss out on high intent firms due to this limit?
A: Based on our analysis, we have determined that a focus on the top 250 active firms over a 12-week period, provides an effective representation of highest intent firms specific to each of our clients. Because the data is updated weekly, and the date of engagement is an important factor in the intent score evaluation, it ensures that the most relevant firms are always visible and actionable for BPMs on a weekly basis. We continuously monitor BPM firm engagement and if a certain threshold (>250) of high intent firms is observed on a weekly basis, then we will increase this limit to reflect a growing audience. To ensure that no high intent firms are missed, we recommend checking the leaderboard weekly and/or scheduling automatic weekly exports of the leaderboard in excel format with the user metadata expanded.
Q: Why is my "Click" metric lower than the "Download" metric?
A: This can happen when users perform multiple download actions on the same product (i.e. downloading different file types or combinations of file types). The action of clicking to initiate a download is only counted as a download, not both. There are also multiple areas on our site where users do not need to perform a click in order to download your content (i.e. after a search users can download a package of relevant files without clicking into a specific piece of content). We are dedicated to encouraging AEC professionals to download content and try to limit barriers preventing them from specifying BMP content in their projects. Each additional step in a user's journey decreased the chances for conversion.
Q: How long will historical data performance data be retained/accessible?
A: At this time, CADdetails can offer infinite data retention for performance trends in CADdetails Analytics. For the foreseeable future, there are no technical or cost implications preventing us from preserving this data and allowing clients to view years of data. In the future, we may implement a 3- or 5-year data retention cap as the data becomes less relevant over time. The Leaderboard data is not stored over time, so if you want to have a record of design firms that appeared on your Leaderboard we recommend setting up an automated export.
Q: Will the leaderboard contain relevant firms from a clients Design Hub/Microsite?
A: Yes, but they still need to be based in Canada or the US and rank in the top 250 firms based on their engagement on CADdetails.com and/or Design Hub/Microsite to appear. Because all design hub users, for a specific client, engage directly with that client's content they have high intent scores if they were active in the last 12 weeks. Firms active on Design Hub are likely to appear near the top of the leaderboard. All users, regardless of where they perform actions, are evaluated collectively based on the quality, quantity, relevance and recency of their engagement.
Q: What is the benefit of including firms from our Design Hub/Microsite in the Leaderboard?
A: While you obtain granular reporting data through Design Hub Analytics, integrating this data into the leaderboard gives you enriched firmographic data not available on that platform. Specifically, you gain:
Firm metadata including website, LinkedIn, employee count, industry and geolocation.
Additional users from a specific firm who did not visit your Design Hub/Microsite but engaged in relevant content on CADdetails.com are included, giving you more visibility into that firm's activity.
Additional user metadata is provided including their preferred content types and product categories.
The Leaderboard provides a concise and actionable list of recommended firms garnered from all our platforms, streamlining your workflows and providing more robust market research material
Q: What is the Active Firms KPI?
Active Firms is a new KPI on the Overview tab. It shows the total number of design firms — made up of registered, high-intent users — that were exposed to your content during your selected date range.
Q: Why do some KPIs on Product Intelligence show as an average instead of a total?
A: On Product Intelligence, Impressions, Clicks, and Downloads are additive totals summed across your selected product types. Unique Users and Active Firms are shown as a weekly or monthly average instead, matching your selected aggregation — this avoids double-counting the same users or firms across weeks.
Q: How much do impressions & unique users typically fluctuate month to month?
A: Impressions and unique users are industry standard exposure KPIs which reflect how much your content is shown and how many visitors were exposed to it. However, exposure KPIs depend on the client specific product categories and the active user base on the site. Impressions and unique users fluctuate based on:
Overall Site Traffic (Ex. During the winter holiday season KPIs tend to be 30-50% lower than normal)
Featured Content
Seasonality & Industry Trends
Content Variety and Keywords
Competitive Landscape within Product Categories
Q: Why are user emails not included in CADdetails Analytics?
A: Due to the changing landscape around privacy laws we want to ensure that we retain the trust of our AEC users while still enabling our BPMs to understand the audience that is engaging with their content (or related content). We present critical firmographic data and insightful user metadata that will help BPMs tailor their marketing initiatives. Further, using intent based design firm recommendations we assist BPMs in prospecting and nurturing existing customer relationships without exposing PII data of users who have not provided explicit consent for BMPs to contact them.
Q: How current is the data on the Firm Intelligence tab?
Firm Intelligence always reflects the most recent 12 weeks of activity — the typical active project period for design firms, based on CADdetails' internal research — and does not have a configurable date-range filter.
Q: Can I filter my leaderboard or benchmarking data by region?
A: Yes. On Firm Intelligence, click any state or province on the interactive map to filter all data on that tab to that region; click it again to clear the filter. Filters on Firm Intelligence are independent of the filters on Overview and Product Intelligence, so changing one won't affect the others.
Q: What is Intent Score, and how is it calculated?
A: Intent Score reflects the quality, quantity, and timing of a firm's engagement with your content — including activity like viewing and downloading your assets. Firms with the highest scores are the ones with the most recent and most extensive activity.
Each firm falls into a Score Band — High, Medium, or Lower intent — based on their score. Hover over any Intent Score in your dashboard to see a short description of what it reflects.
For a full breakdown of how each Score Band is defined, see page 12 of the Analytics User Guide, also linked at the top of your Analytics dashboard.
Q: How Can BPMs Leverage CADdetails Analytics?
A: Building Product Manufacturers (BPMs) can leverage the CADdetails analytics data in several impactful ways. Below is a summary of potential use cases, along with specific departments and online tools that could benefit from this information:
Sales and Business Development
Use Case: Prioritize outreach to design firms with high intent scores, indicating they are more likely to convert (download or click content). Firms with sustained or increasing engagement offer strong potential for prospecting initiatives. Recognize firms on the leaderboard to confirm ROI and nurture relationships with existing clients.
Tool: Sales Prospecting Initiatives & CRM systems. Leverage CRMs such as Salesforce or HubSpot to track these firms, segment prospects, and set alerts for changes in intent scores, particularly for those new to the leaderboard.
Many industry-leading CRM systems are designed to handle firm-level data, allowing you to manage accounts and leads based on firm-wide metrics like intent score and engagement trends. Most CRMs are also capable of associating multiple users with a single firm account, making it easy to toggle between firm and individual user views.
Best Practice: Use firm-level scoring (such as intent scores) as account-level metrics
Benefits: Targeting firms that are actively engaging with specific product categories can streamline efforts, resulting in higher conversion rates, more efficient lead/account nurturing, and reducing churn for repeat customers.
Marketing and Advertising
Use Case: Tailor marketing campaigns based on industry engagement data, geographic insights, and top-performing content categories. The Performance Metrics dashboard highlights which content resonates most, helping refine messaging and ad placements.
Tools: Ad Platforms (e.g., Google Ads, LinkedIn, Facebook Ads) for retargeting high-engagement firms.
Some Ad platforms such as LinkedIn support targeting based on firmographics and allow you to create firm-level campaigns or custom audiences to target individuals at specific companies or industries. LinkedIn’s Account-Based Marketing (ABM) features can help narrow down campaigns to specific firms and target specific users.
Benefits: Focused marketing efforts on the most engaged firms, industries, or locations maximizes ROI on ad spend. The data helps optimize ad campaigns for content types that resonate most, such as CAD, BIM, or 3D files.
Product Development and Content Strategy
Use Case: The data on top content categories and high-performing files helps inform product teams about the resources most valued by design firms. They can then prioritize developing similar content types or formats.
Tool: Content Management Systems (CMS) for adjusting content production in line with demand. This also integrates well with Digital Asset Management (DAM) tools such as Prodify.
Benefits: Producing content that aligns with the interests of key audiences enhances BPMs’ value and relevance in the marketplace, increasing the likelihood of repeated engagement and brand loyalty by AEC professionals.
Customer Success and Account Management
Use Case: Use firm-based metrics to track overall account health and flag high-potential accounts based on recent engagement trends.
Tool: Customer Success Platforms (e.g., Gainsight) to monitor client account health and share performance insights. Customer success platforms are designed with a firm-level focus, tracking engagement, account health, and renewal indicators across firms rather than individuals. They’re highly suitable for monitoring firm-level metrics like intent scores or engagement with product categories and content types.
Benefits: Strengthens relationships by providing BPMs with actionable intelligence on firm engagement and areas for growth. It also empowers account managers to proactively address declines or capitalize on new opportunities.
Strategy and Market Research
Use Case: Insights into firmographics and changes in trends from the Design Firm Leaderboard and Performance Summary helps BPMs identify geographic, profession, seasonal, and/or industry-based gaps and expansion opportunities.
Tools: Market Research Platforms (e.g., ZoomInfo, LinkedIn Sales Navigator) to explore firm backgrounds and relevant company networks. Import Leaderboard data into these tools to expand your knowledge base and enhance prospecting potential.
Benefits: Strategic insights on firm distribution by state/province, industry, and intent score allow BPMs to identify new markets or adjust their positioning in existing ones. Additionally, it provides insight into branch collaboration and regional distribution of firm resources. Understanding engagement trends can identify strategic timelines for product launches and investments in advertising.
Data-Driven Decision-Making and Reporting
Use Case: Data exports provide a foundation for in-depth analysis, enabling BPMs to track and visualize trends over time or share metrics with stakeholders.
Benefits: Consistent data-driven updates on performance can inform executive decisions on investment areas, resource allocation, and long-term strategy.
Q: How does the Leaderboard work? What is "Intent" & how is it calculated?
A: The top 250 recommended Design Firms ranked by intent score. Intent score is calculated through a proprietary algorithm based on quality, volume, and recency of engagement with your products and related product categories. Intent scores help identify firms most likely to convert (click or download your content).
Quality - Conversion events (on the leaderboard this includes clicks and downloads) are aggregated by user when they either click on or download your content and/or content in related product categories. This engagement is then aggregated across all relevant listings and projects and scored for each BMP. The scores for each BMP are dependant on the volume, specificity, and relevancy of each product category for that BPM.
Downloads are higher "intent" than clicks.
Direct engagement with your content is also higher "intent" than engagement with competitor products alone. But, both are important.
The competitor content that matches your product categories increases in relevance with it's specificity.
Volume - The number of conversion events performed by the users. Intent increases with volume of activity
Recency - How recently the user engaged. Over time, if users do not return, their intent will decrease each week.
A: Please refer to the content in this blog for more information about intent and how it is helpful to BPMs.
: Is there a way on the leaderboard to identify which firms are looking at our competition?
A: Yes, as you scroll down on the leaderboard you will see the intent score go down. You can think of it as a percentage or spectrum (although that's not really what it is). The higher the intent score, the more likely that firm is to click or download your content vs. a competitor's. For example, firms who have <50 intent score in the Leaderboard are more likely to engage with related competitor content than yours but that is an over simplified analogy and really depends on the overall volume of engagement in your product categories as well as other factors.
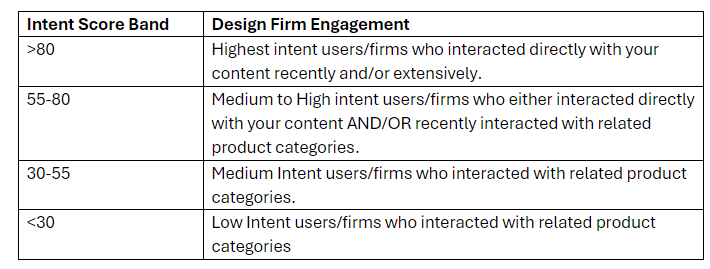
A: There is no distinct line between firms/users who only engaged with your content vs competitor content. Here is a visual from the user guide which roughly defines the Intent Score Bands, you can leverage that as an estimation.
A: Keep in mind that the users associated with each firm are always sorted from most to least relevant, so you can easily identify who is the most engaged from each firm overall and how members of their firm may be collaborating.
Q: Why are there some post secondary institutions and educational users appearing on my Design Firm Leaderboard? I thought they were filtered out.
A: While users who register as students are filtered out, some users identify themselves as interns or have email domains that are associated with a post-secondary institution, in these cases the user are included on the leaderboard because they are affiliated with Design Firms and working on professional projects.
Q: There are two set of columns for Country, Province and City on the Leaderboard, depending on which way I sort it, the number of Canadian firms changes dramatically. Can you confirm which one to use for our US vs. Canadian Sales Ops?
A: The first set of geolocation columns reflect the design firm's the firm's most active branch location according to our database. The second set of geolocation columns are specific to the users from each firm (this data provides a more granular view of branch collaboration for large firms).
Generally, the firm level geolocation data is a reliable way to segment for sales purposes, but in majority of cases you will find more Canadian matches if you filter on the user level geolocation. That said, filtering on firm level will ensure that there is no duplication of firms between your US and Canadian sales teams. The later approach will result in overlap/duplication of firms but can be a more inclusive approach if that works for your marketing/sales team's workflow and the team can manage that duplication.
It's worth mentioning that the users for EACH firm are sorted from most to least relevant. For example, if you see a design firm with a headquarters in the USA but the first appearing user for that firm is located in Canada, that indicates that Canadian branches from that firm have the highest intent currently according to your leaderboard.
I hope that helps! If you have any questions or specific use cases you would like to share with us then we would be happy to address them and leverage your feedback in future updates to these dashboards or new analytics resources we may create. Also, if there are any functionalities you would like to see added that would make leveraging this data easier please don't hesitate to share that with us as well.
Q: On the leaderboard, some states are missing from the filter dropdown. I want to set up a bookmark for a specific region that includes all the states, how can I do this?
A: "You can add the state to the filter drop down even if it doesn't appear to have activity, so when/if it does have activity in the future, it should show up by default based on your saved bookmark/view and the custom values you entered for missing states.
For example, below "Wyoming" doesn't have any data, so it doesn't show up in the filter drop down. But you can enter the value for that state (letter case and spelling is important). This is what it looks like:
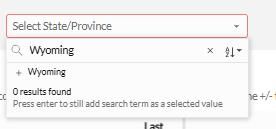
Then if you hit ENTER, it looks like this:
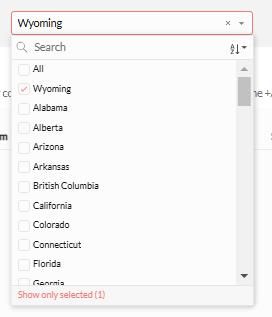
You can repeat this process for any missing states plus the ones that do appear, save as a bookmark, and when/if data from that state appears it will be included in the filter and your saved bookmark/view 🙂. "